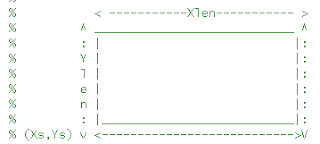
The script is not really useful. However, it shows how a matlab function works. More matlab functions will be added later.
function PlotRect(Xs,Ys,Xlen,Ylen,LineC,LineS,LineM)
% To draw rectangles with given position and properties
% Usage: PlotRect(Xs,Ys,Xlen,Ylen,LineC,LineS,LineM)

% e.g.,
% PlotRect(0.1,0.13,0.7,0.6,'k','-','.')
% http://scriptdemo.blogspot.com
if exist('LineC','var')~=1
LineC='k';
end
if exist('LineS','var')~=1
LineS='-';
end
if exist('LineM','var')~=1
LineM='none';
end
if ~ishold on;
hold on;
end
xx=[Xs Xs+Xlen Xs+Xlen Xs Xs];
yy=[Ys Ys Ys+Ylen Ys+Ylen Ys];
hp=plot(xx,yy);
set(hp,'color',LineC,'linestyle',LineS,'Marker',LineM);
|
No comments:
Post a Comment